
An interesting meme was making the rounds on Mastodon. The first row of this meme paints a happy picture for the USA.

At the same time, the Alberta government was bragging that the average wage in Alberta has risen to $34 an hour. This wage translates into about $60,000 a year. This income should qualify people to get a mortgage for a small house or condo. When average people can get such a domicile, all is economically well in Alberta. The “American dream” in Alberta is still alive. So says the Alberta government.
A Basic Statistics Primer
Most university students have to take one statistics course in their undergraduate years. Most university students regard this course as something trivial that the “authorities” are forcing them to get their degree. I was one of those students. I took the approach to learn just enough to pass the course.
In my few engineering years, I had only one occasion to apply rigorous statistics to make a certain point. I returned to the statistics textbook to learn how to do a t-test. I haven’t done one since.
Despite my less-than-enthusiastic approach to university statistics, my statistics course had provided me with insights in how to analyze data. Of all my 48 engineering courses, statistics is probably in the top five in how to understand the world better, even though my skills in statistics are far below that of a mediocre statistician.
I am going to provide a basic statistics primer in this essay, going to my favorite source to find things quickly: Wikipedia. My first lesson is the “Normal Distribution.” Here is the Wiki graphic:
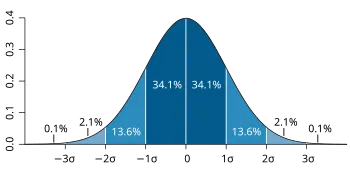
If Alberta wages are distributed normally, the average of $34 per hour would be in the middle of this graph. Most of the people would be around this average.
To be more technical, we should call $34 a “mean average.”
With the minimum wage being $15.00 per hour, the numbers of minimum wage workers should almost be zero — if the data was a normal distribution. On the richer end of this distribution, the higher wage of $49 ($34+$15) would be as small as the minimum wage workers — again if this data was a normal distribution.
You have probably figured out that wages in Alberta are not normally distributed. A better representation would be the left-skewed distribution, and Wiki offers this graphic.
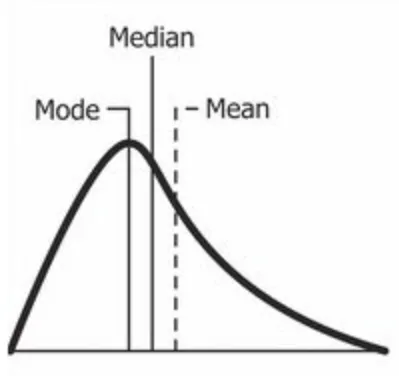
Wikipedia
Because of the minimum wage, this distribution would not extend lower than $15.00. So that date an the left would represent the high number of minimum wage workers.
If the mean average is $34 and this distribution is indeed left-skewed, there has to be a lot of people earning less than $34 to offset the fewer people earning more than $34 — to get that $34 average.
For a left-skewed distribution, an important parameter would be “medium average.” This is often called the “medium.”
The medium average wage basically says 50% of the workers are earning less than this wage and 50% are earning more than this wage.
With the minimum wage being $15 and the average mean wage being $34, I estimate the medium average about $25. This wage would not be enough for a single person to afford a mortgage in Alberta.
When the Alberta government tells us that the average wage has risen to $34, that is not telling the whole story. Eight years ago, the minimum wage was increased to $15. I’m not getting a sense that minimum wage employers in Alberta have given their employees a raise that reflects the post-Covid inflation. But some businesses who used to pay $20 were having trouble finding experienced workers. So they have bumped the wages to $25, passing on the extra costs to their customers. And tradespeople in Alberta are in short supply. They were (on average) getting $35 pre-Covid. But today, they are probably closer to $45. In other words, the $34 figure incorporates how the higher end of workers are getting raises and the workers on the low end are not.
How the management and professional classes are reflected in this data, I am not sure. If they are somehow included, then the increase to $34 could have been mostly caused by giving the higher classes a big raise — and everyone else stays the same. If so, the mean average increased, which sounds like good news. But the medium average did not.
In other words, the Alberta government is leaving out an important detail with its claim that the mean average wage is $34 per hour. It would be better to include the medium average to describe the state of the average worker in Alberta.
Statistics & Politics
Imagine the premier of Alberta at a news podium. She can present her statistics in one of these two ways:
1. The average wage for Alberta workers has risen to $34 an hour.
OR
2. The wage distribution has improved for certain workers. The mean average is now $34 and the medium average is now $25. Unfortunately, those workers closer to mininum wage have lost buying power to the inflation we saw in the last four years.
Both statements are truthful. But the teleprompter script would be scrolling the first script. It is short and gives happy news to everyone. It will make a good 10-second video clip, which many TV news stations will pick up. All is well.
The second script is longer and suggests that not all workers are enjoying the new prosperity. It is more technical, and I suspect half the population would not know the difference between a mean average and a medium average. They would not stick around to watch the commercials.
But the second script has much more truth than the first.
Medium contributor Allan Milne Lees wrote a book called Why Democracies Fail. Mr. Lees posits that 86% of the population is incapable of understanding the issues well enough to vote wisely. Political parties seeking to gain power cater to the mindset of the 86%, not bothering to craft their message to satisfy the 14%. I think there is a lot of truth here. Hence Script 1 wins over the 86% more than Script 2. The 86% will buy into the mean average story, even though many of them have not been part of the raise to get that $34.
A political axiom is that the better politicians are able to explain complex things for simple people. That’s how they earn votes. Script #2 is a way to lose votes. But, too often, politicians tend to believe that their simple explanations are sufficient. It’s not hard to imagine that the political leaders in Alberta prefer the mean average angle over the medium average angle. But the sad part is that they start to believe that all workers have benefited from this increase in mean average. In essence, the entire science of statistics has just been thrown out the window.
I should caution readers that this particular essay has not been prepared to my satisfaction. I could not find the original $34/hour newsclip that inspired this article. I didn’t chase down the source of the meme. I was getting conflicting data from different sources. I estimate another 20 to 40 hours would be needed to investigate these various claims and understand the data. I can’t justify this time for an article that is likely to generate 10 readers. Regardless I think most of this article’s 10 readers would agree with these main points:
1) This essay shows that the mean and medium averages paint a better picture than just the mean average.
2) We throw out sound statistical analysis for political convenience.
3) We don’t understand the science of statistics, so it is easy to discredit it when the statistics do not line with our current thinking.
Whatever flaws this essay may have, I think these main ideas still hold true. I think the $34/hr figure and the left-skewed distribution are reasonably accurate, based on my years of casual observations of the Alberta economy.
Now for the full meme on the American average income:

The entire meme is painting a different story than its top part. From my perspective, this meme is showing how a left-skewed distribution really works — without having to get into much detail about how a left-skewed distribution really works. I think many viewers of this meme instinctually understood that giving raises to top workers doesn’t do much for the lower-wage workers.
But our politicians will skillfully use the mean average for their own political gain.
How can we solve societal problems if we use statistics in such a biased way?
Published on Medium 2024
Popular Ways to Improve Democracy
Western Democracy is a Ford Model A
