
Pavle Marinkovic posited that the human body responds well to sounds at a frequency of 432 Hz.
My apologies: this link won't work unless you are a Medium member.
So many things in the natural world like their natural resonance. Why not our bodies? This hypothesis deserves more attention.
As I was reading this article, I remembered a math challenge I gave myself circa 1990. I was trying to figure out the magic of musical notes. I knew this science had been done centuries ago. But I liked figuring things out for myself.
So I measured the distances between the frets of my guitar. I spent a few sittings trying to massage these distances into some kind of mathematical relationship, maybe spending 10 hours in total. But I didn’t find the answer. I kind of gave up.
Pavle’s article brought back my 1990 challenge to me, which I mentioned in my response.
That response got another response from Mykyta, who seems to be elusive for me to tag. He mentioned this clue.
These relationship you were looking is “equal temperament”. It divides the octave into 12 parts, all of which are equal on a logarithmic scale, with a ratio equal to the 12th root of 2.
When I read these words, I immediately garnered an intuitive understanding of where I should have taken my 1990 challenge. Yep, that clue should have helped me out. I went back to 1990 — to figure things out for myself.
And in 2023, I had the advantage of spreadsheet software to help me grind out the numbers and graphs.
Setting Up My Experiment
I based my analysis on Middle C and its major scale. “Why C?,” you ask. Well, C is a favorite key of novice guitar players like myself — and it has no notes with sharps and flats. This makes the presentation a bit simpler. So the major C scale is: C-D-E-F-G-A-B-C. See, no sharps or flats.
Imagine a fictitious one-stringed instrument. We tie one end of the string to a peg in the instrument’s body; the other end is threaded through a hole in a cylinder in the head and secured. The string drapes over two immoveable bars, one called the “bridge” and the other called the “nut.”
The cylinder has a mechanism to tighten the string, increasing its tension. At a certain tension, the string will settle into the bridge and the nut, creating the two fixed points for the string to vibrate. This defines the “musical length” of the string.
When we pluck this string, it will vibrate between the bridge and nut. We can see the vibration. The vibration sets air molecules to vibrate to create a sound wave. The sound wave is amplified by the instrument’s body. We hear a certain pitch.
When we tighten the string more, the pitch gets higher. The pitch is related to the frequency the string is vibrating at. The frequency is a natural response to the string’s material, the tension, and the distance between the nut and the bridge. Change any of these parameters, the frequency — and pitch — change.
Regardless of the pitch, the string coupled with the instrument creates a clean and uniform sound. Our brains like this sound, at least much better than it likes noise. We could call “noise” a collection of many random frequencies, which are not so pleasant to hear.
We tune that string (adjust the tension) to Middle C, which has a frequency of 261.63 Hertz (Hz). Hertz means “cycles per second.” So our middle C string is vibrating 261.63 times per second.
For this Medium analysis, I will represent the Middle C sound visually. Trigonomic functions are great for creating these wave/oscillations representations. After some experimentation, I settled on the cosine function and a duration of “60 radians,” which I will explain later for those with less math than I have.
Here is the visual representation of the sound of Middle C:

Remember this is just a representation, not the actual sound. As I go through this analysis, I will be comparing other notes to Middle C. With this comparison, we can see the resonance, or how two sounds are tracking each other. In real life, this resonance will actually be with sound waves, not graphs.
In this representation of 60 radians, the cosine wave goes through 10.5 cycles. Because Middle C vibrates at 261.63 Hz, this visual representation only shows 0.04 seconds (10.5/261.63) of the string’s vibration. Nonetheless, it is safe to assume this pattern will continue until the string stops vibrating.
Well, not quite so. Did you notice that this sound cycles from 1 to -1? This distance is called the amplitude, which we would call the “volume.” As the vibrating string loses energy, the amplitude will decrease. But during this volume decrease, the string continues to vibrate at its natural frequency: i.e., lower volume, same pitch. I could have shown this decline with an “exponential decline” function. But today’s analysis is to show resonance of the major scale notes, so the volume decline is not important. Rather we will assume the 0.04 seconds, which has been converted into a visual representation, does not have a significant volume decline.
From hereon, I might be calling Middle C as the “fundamental (frequency)” and “the first.” These are common terms for music theory.
The Octave
Here is the basic physics behind the octave.
If we cut a fundamental string exactly in half (while keeping the same tension) and pluck the string, this new string will vibrate at twice the frequency as the fundamental. That is just a truth about nature, physics, and tight strings, not something we can declare or decree.
In our fictitious one-string guitar, the fundamental can be defined by the distance between the bridge and the nut. Pluck the string between those two parts and the string vibrates at its natural frequency. Regardless of how we pluck the string, we always get the same frequency. Remember we have adjusted the tension in our instrument to vibrate at 261.63 Hz.
We put a fret exactly half-way between the bridge and the nut. Press the string down on that fret. The fret becomes the new fixed point — and the string has been effectively cut in half. Pluck the string between the fret and the bridge. It will now vibrate at twice the frequency, as compared to when the string was “open.”
In this case, our string now vibrates at 2 x 261.63 = 523.26 Hz. This frequency is called an octave. All octaves are a multiple of 2, 4, 8, etc. of the fundamental.
Well, twice the frequency than before sounds kind of nice. But what does this really mean? To answer, here is my graph of the Octave C:

For the math heads out there, I used the equations “y = cosine (r)” for the Middle C graph and “y = cosine (2 x r)” for the Octave C graph, where “r” is the radians.
We can see that the Octave C has about twice as many cycles as the Middle C.
Now we are adding a second string to our instrument. We tune that string to Middle C as well. We pluck the strings at the same time, but one string will be open and the other at the half-way fret. Let’s superimpose these two sounds:

We see a recognizable pattern with these two curves. We see every second Octave C “crest” meets with each Middle C crest. When these “high points” meet, the two curves have resonance with each other.
Now here is where we can see the magic of music a little better. We now add the amplitudes of Middle C and Octave C together:

Here’s a few pointers to help interpret this graph.
1. When the curve reaches a y-value of 2, this means the two strings are hitting their maximum amplitude at the same time. When the 1 of Middle C is added to the 1 of Octave C, that’s how we get the 2. In other words, the two strings are reinforcing each other to give a bigger amplitude.
2. When the curve reaches a y-value of -2, the two strings are hitting the maximum amplitude but in the opposite direction. This C-C curve does not show a -2 value, but the next curves will.
3. When the amplitude is zero, the strings are not making any sound. There are two reasons for this: 1) both strings are at the 0 of their own cycle or 2) the strings are of the same amplitude but in opposite directions, effectively cancelling each other out.
4. Remember that the 60 radians correspond to about 0.04 seconds. Our brain will hear the sounds close to 2 and -1 values. But because the wave moves so fast, our brain will not be able to separate the loud parts from the silent part of this blended sound.
Remember that these graphs are visual representation of the sound of the note(s). Middle C has a certain sound. Octave C has a different sound. The above graph shows the sound when we combine Middle C (261.63 Hz) with Octave C (523.26 Hz). Two notes struck together create a different, yet still pleasing, sound.
This C+C sound shows the crest-to-crest resonance happening every six radians (when 1+1=2). Between the crests, there is a consistent pattern. This consistency produces a pleasurable sound for our brain to enjoy.
Not only that, the amplitude increases. In either C by themselves, the amplitude ranges from -1 to 1. In the C+C, the amplitude ranges from -1.1 to 2.0. In essence, the C+C increased the volume when the two C’s are played together.
The octaves produce a nice sound because they have a lot of resonance, which means the sounds waves blend well with each other.
The 12 Notes of the Major Scale
In the previous section, we showed the resonance of the fundamental and its octave. Resonance creates a pleasurable sound.
We will now show the resonance of the notes between these two notes.
Several centuries ago, the designers of music allocated 12 divisions between the fundamental and its octave. Why did they do that?
Well, 12 is an interesting number. It is divisible by 2, 3, 4, and 6. So I can see some resonance with these numbers. But how to allocate the 12 spaces between the fundamental and the octave? I could see that my guitar was not showing 12 equal divisions between the frets of the open string and octave. In fact, the fret spacing was getting a little bit shorter as the frets moved down the guitar’s neck. Somehow there had to be a geometric progression, which I just couldn’t figure out in 1990.
But the 12th root of two” was the clue got me past the roadblock.
I used my calculator to find the twelfth root of two, which is approximately 1.059463. In other words, this means that when I multiply 1.059463 by itself 12 times, the result is 2.
So now I am going to create a table, where the frequency of each of the 12 notes is multiplied by 1.059463 of the previous note. I will start with Middle C and its 261.63 Hz. Here is the table:

I promised that I wouldn’t put in any sharps or flats in this essay. But I need to expand this table to give each of these notes a name, to help us understand music theory.
As well, I have added a column of the “Do, Ra, Mi, . . .”, which are the singing notes many readers have some basic knowledge. The “Do, Ra, Mi, . . .” are actually the notes of the major scale. Singers-in-training use these mnemonics to train their voice boxes to make the appropriate frequency jumps as the melody changes.

Combining C & D
I’m going to analyze each note of the major scale in a similar way that I analyzed Middle C and Octave C. Each combination is going to produce a different C+X curve, which means a different sound.
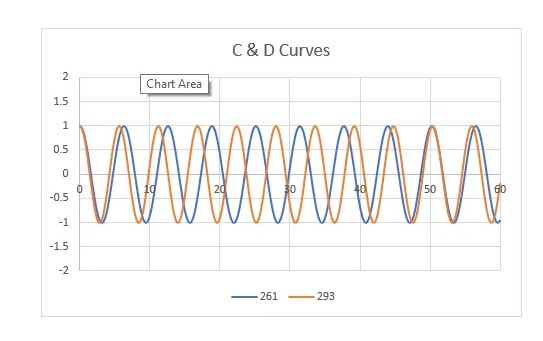
The two equations are: y = cosine (r) and y=cosine (r x 1.11225), where 1.11225 is the frequency of D divided by the frequency of C (293.67/261.63)
Now we can see the crests of the two curves meeting at 50 radians.
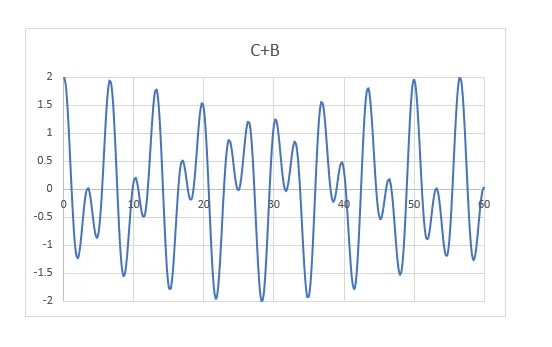
Now we will see the magic of adding the two curves together:

When the graph reaches 2, the two crests of the C+D curves are meeting each other. One C-D cycle is from one of these conjunctions to the next. This graph shows the conjunction at 50 radians. We can see the pattern starting to repeat itself after 50 radians. If the graph continued, we should see the next cycle at 100 radians.
There are a couple of points where the amplitude looks like to be -2. The data table that made this graph said not exactly -2, but close. The two curves are close to being synchronized at this time, but they have drifted apart a little because they are at slightly different frequencies. As the cycle continues, the drift gets bigger.
The C-D blend also has a significant period of small waves (between 22 and 28 radians). At this time, C sound wave and D sound wave are “out-of-phase” and mostly cancelling out each other. So the two strings are not making much sound. But the sound waves are still oscillating quite fast, so our brains will only hear the “loud” parts of this blend. After 28 radians, the two sound waves start moving into sync with each other again.
Between 0 and 50 radians (the cycle of the C-D blend), there are eight smaller peaks.
Following are similar graphs for all the notes of the major scale.
Combining C & E

Notice that the first crest-to-crest is at 25 radians — and repeats at 50 radians. This conjunction happens earlier than the C-D combination:
I see four peaks between the cycles, which is fewer than the C-D graph. The C-E is less complicated than the C-D.
In other words, the C-E has better resonance than the C-D. The resonance happens quicker, and the blended sound is simpler.
I was expecting the C-E graph in the first cycle to be exactly the same as the second cycle. We can see some slight differences.
I have several hypotheses as to this anomaly:
1. All my calculations use five significant figures; maybe I should have used six.
2. I built my graphs in increments of 0.25 radians. Between these “fixed” points, the spreadsheet will draw its own points based on a best fit algorithm. I might be able to fix this with increments of 0.10.
3. The resonance seen in this graph might be a close resonance, but maybe not an exact resonance. If so, I would need to extend this graph beyond 60 radians to find that exact resonance. But with such an extension, the peaks and troughs would be too close together to get a good visual picture of the sound waves.
Whatever the errors are, we can still see the primary pattern and which notes are resonating better with Middle C. So I’m not going to chase this anomaly down.
Combining C & F
Now, the crest-to-crest cycles repeat about 19 radians.

This time there are three peaks per cycle.
I can see some small differences in the curves between the cycles, but much less than the C-E graph.
Combining C & G

Now the crests meet at 12 radians.
There are two peaks per cycle.
The peaks between the cycles look to have the same pattern. I see just a touch of the anomaly that we saw in C-E and C-F.
Combining C & A

The crests meet at 19 radians.
There are four peaks per cycle.
Like the C-E graph, there are slight differences in the inter-cycle patterns.
Combining C & B
The C-B curves don’t fully match until 56 radians. But the peaks next to the resonant peak are quite close to the full value.
There are 16 peaks in the cycle.
We can see the first half of the cycle is a reflection of the second half. Another sign of some resonance.
Because the cycle took 56 radians, we cannot see how well the pattern repeats itself. I will just assume that this more complicated pattern will repeat itself between 56 and 112 radians.
Musical Summary
Here is a summation of the fundamental with the seven notes of the major scale.

In all of these seven notes, we get the cycles resonating within 60 radians.
I developed a resonance ranking, based on how quickly the combination found its first resonance radian and how many peaks between the cycles. The quicker the peaks meet at an amplitude of 2 and the simpler the blended sound, the better the resonance.
Of the seven notes, the octave has the best resonance.
The notes F and G have the better resonance. Music written in the Key of C use F and G chords to accompany the C chord. F is often called “the fourth.” G is often called “the fifth”. Songwriters like using the first, fourth, and fifth, especially for simpler music.
The notes E and A have middle resonance. My analysis seems to suggest that A has a little better resonance than E. But my experience is that the Note E is used more in simple music for the key of C then the Note A. Based on this similarity of resonance, I’m not sure why E and A are not more equivalent in terms of usage in the Key of C.
The notes of D and B have the lower resonance. And these notes are less used than E, F, G, and A in the Key of C. The second and the seventh of the major scale are not as popular, because their resonance is not so great.
Taking the Project a Little Further.
I’m sure acoustical engineers and musical theorists would see my approach as primitive.
But I had fun! And I figured it out mostly by myself! Thanks again to Mykyta for that little, but significant, hint.
I hope readers learned something about music theory. For some readers, maybe I have explained the basics of the major scale better than the experts.
This essay is getting a little long. So it’s time to stop this technical analysis for now.
I am going to do a little more work on this project. I want to see the cosine curves for (1) the minor scale, (2) frequencies not on the “twelfth root of 2”, and (3) major and minor chords. Expect at least three more essays on basic music theory.
By then, I will have exhausted my limited understanding of this topic.
Music & A New Democracy
Some of you came to this article based on your interest in music, math, or physics. If so, I have found a new audience.
You see, my primary purpose for being on Medium is to promote my alternative democracy. So hopefully my new audience will give me a little patience as I change the direction of this essay.
The musicologists of four or five centuries ago gave themselves a great challenge. They knew that some sound combinations were more pleasing than others. But this knowledge was more from raw experimentation and tradition than any application of science. The musicologists turned to scientific approaches to understanding music, not just “what sounds good.”
From my understanding, the medieval scientists used horizontal open pipes (or chambers) to conduct their experiments. When random sounds entered the pipe, most of them cancelled each other out. But the length of the pipe allowed one frequency to reflect back to the source and cycle back — again and again. These reflections amplified each other, creating one dominant resonating frequency. All other frequencies became insignificant.
These scientists threw some fine sand in the pipe, and the dominant sound wave would push the sand into little dunes. The scientists measured the distance between the dunes and observed certain patterns. Then they used math to explain the patterns.
Somehow the “the 12th root of two” came from their analysis. From there came musical theory and musical notation. They designed instruments. And they then wrote new music, which we still enjoy today. From their work, we have built other kinds of music: classical to rock to folk to jazz; all are based on “the 12th root of two.”
Where would music be today if the medival musicologists did not apply science to music?
So what is “the 12th root of two” in western democracy?
It could be said that the magic of western democracy is that the governors of society govern at the pleasure of the people. Maybe that is it.
If so, this magic seems to be waning.
Or maybe the magic is allowing two opposing sides to oppose each other so that average people can hear both sides — and then decide which side is wiser.
So how is that working for us?
While we are awash with political experts and political amateurs with their own opinions on how to improve democracy, I don’t see anyone suggesting anything like “the 12th root of two.”
Rather, I hear banging on pots and pans, hoping for a nice sound to magically happen.
We have to find the more capable people for governance and put them in a consultative forum. When they combine their knowledge, experience, and wisdom with each other, they will find one harmonious voice. They will find the directions and solutions that will resonate in society.
The fundamental is to bring in all sorts of opinions, perspectives, and facts into the deliberations. Then we civilly sort things out. This means having an open mind — and being willing to let go of long-held positions.
Sounds too utopic, right? But if we don’t think in this way, we are indeed just banging on pots and pans. It’s going to be a long time before any nice sound comes out. If it does, it won’t be a versatile sound that can be applied to different social issues.
The attributes required are not part of the nature of political parties. To continue governance with political parties means we won’t get to where we need to go. The parties must be cast aside!
Just as the medieval musicologists who found new scales, chords, and keys, the early builders of this new democracy will learn new ways to get along better — just like the six strings in my properly tuned guitar.
And just like proficiency in music, we need lots of practice. Building this democracy is our practice forum.
I invite new and current readers to my alternative democracy. We really need to engineer governance into something musical. We really need more resonance and harmony. We really need a “12th root of two” to move forward, politically speaking.
Published on Medium 2023
"New World Coming" that we cannot see
